Merging data from different sources into a single dataset is a common task during the data processing phase of data analysis. Many political scientists work with comparative country-level questions and this data is usually structured in the “country-year” format, where each row represents a specific country and a year. However, different datasets have different country codes (unique identifiers for each country). For those who are new to working with this type of data, these differing country codes can be a tedious roadblock, making it difficult to quickly merge datasets.
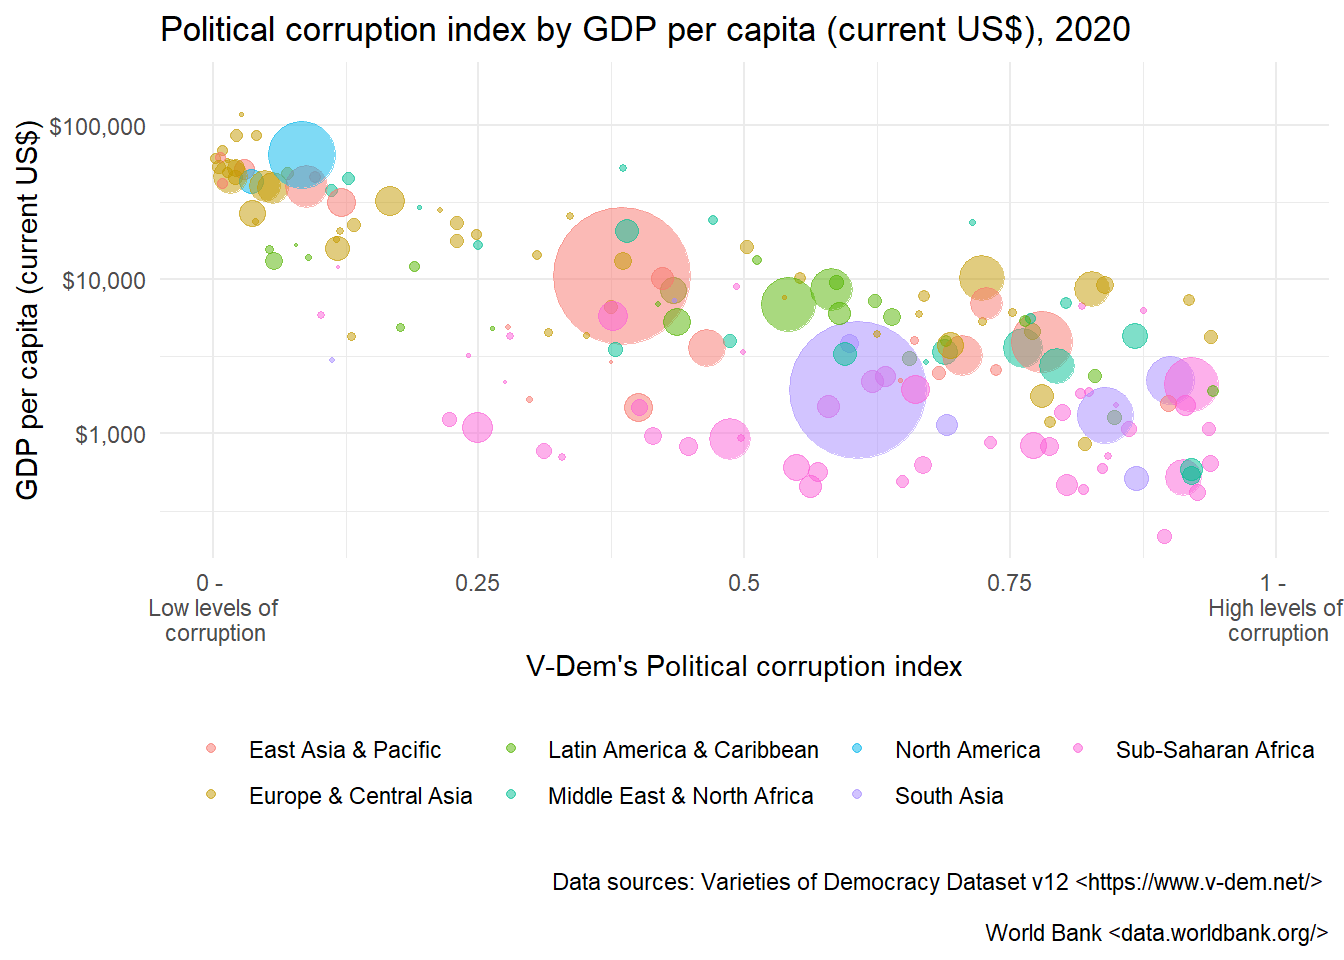
In this tutorial, I’ll go over some of the tools that I have found useful for this task and some of the common frustrations I have encountered. This tutorial is aimed at people who are just starting to work with country-year data or people who have experience with country-year data but have not used R for data management. The goal will be to learn the data preparation steps required to make the bubble plot below and get a sense of some of the tools available for working with country-level data in R as well as some of the quality control processes around merging data.
To make this plot we need the following country-level data: political corruption, GDP per capita, population, and region. To get this data I’ll be using two datasets. For corruption, I’ll be using the The Variety of Democracy dataset. For data on GDP, population, and region, I’ll be using data from the World Bank. Comparative country data sets are often organized in the country-year format. In these datasets, each row represents a unique country and year combination. This allows for both a state-level and temporal analysis. This means that you can analyze both within-country changes over time as well as differences between countries. Below is a selection of the V-Dem dataset which is a good example of a country-year dataset.
| country_name | year | country_id | COWcode | v2x_corr |
|---|---|---|---|---|
| Armenia | 2001 | 105 | 371 | 0.866 |
| Armenia | 2017 | 105 | 371 | 0.817 |
| Ireland | 2006 | 81 | 205 | 0.067 |
| Ireland | 2012 | 81 | 205 | 0.043 |
| Ireland | 2014 | 81 | 205 | 0.037 |
| Kenya | 1986 | 40 | 501 | 0.902 |
| Kenya | 1987 | 40 | 501 | 0.902 |
| Kenya | 1991 | 40 | 501 | 0.889 |
| Kenya | 2013 | 40 | 501 | 0.635 |
| Kenya | 2021 | 40 | 501 | 0.571 |
V-Dem Dataset
In this tutorial, we will be loading in the V-Dem .Rdata directly from a URL. This loads the data into the environment as an object called “vdem”. This is a pretty massive dataset, with 27,380 cases and 4,170 variables. To make things more manageable, I have filtered the dataset so we only have the data for 2020 and I have selected only key ID variables along with the corruption variable (v2x_corr).
For people who want to explore the V-Dem data a bit more, there are currently two V-Dem R packages that are great resources. vdemdata which is the official package from the V-Dem Institute and vdem which is maintained by Xavier Marquez. I’ve only had the chance to explore the vdem package but it is extremely impressive.
World Bank Dataset
To get the data from the World Bank, I’ll be using the wbstats package. I used this package in an earlier blog post about how to automate PowerPoint production in R. I really like using this package because it really makes it easy to programatically access one of the largest databases of observational data at the country level. Another alternative is the WDI package. Both of these packages are extremely similar in function. I prefer the wbstats package as, to my knowledge, WDI doesn’t allow for filtering out aggregated values (for instance averages for regions or income groups) when you only want country-level values.
In the code below I am using the wbstats function wb_data to get population and GDP data from the World Bank database. You can change what indicators you want to grab by using the indicator argument. You can see that these are codes, which you can find using the wb_search function or by going to the World Bank’s online database to find it. Here, I have specified both the variables that I want to download, as well as the final name I want the variables assigned. The values to the right of the equal sign are the indicator codes from the World Bank.
indicator = c("new_name_1" = "WB_code_1", "new_name_2" = "WB_code_2")The next argument is mrv which stands for “most recent value”, which is set to 5. This, in combination with gapfill being set to TRUE, looks for the most recent value in the last five years and rolls the gaps forward for any missing years. For instance, if a country did not have population data available since 2017, this will roll the value forward to the most recent year. Finally, I filter for the year 2020, since this is the year that we will be examining.
In the next part of my code, I am using the wb_countries function to pull the most recent identifying information about the countries from the World Bank. These ID variables include two different identification codes, iso3c and iso2c as well as regional flags, capital city names and location, and the income level of the country. I have then merged the dataframes together, which gives me a final data frame with all of the identifying information about a given country provided by the World Bank.
#### Downloading World Bank Data
#### Loading World Bank package
library(wbstats)

### Download  data from Worldbank using wbstats
gdp_pop_df <- wb_data(
  country = "countries_only",
  indicator = c("gdp_per_capita" = "NY.GDP.PCAP.CD", "population" = "SP.POP.TOTL"),
  mrv = 5,
  gapfill = TRUE) %>%
  filter(date == 2020)

### Merge with wb_countries() dataset
wb_country_df <- wb_countries()

wb_df <- left_join(gdp_pop_df, wb_country_df)

### This works too!

wb_df <- left_join(gdp_pop_df, wb_countries())
The countrycode package
Now we have two dataframes, one from the World Bank and one from V-Dem. Let’s take a look at these dataframes and their identification codes to get a sense of how we can merge them. Below is a sample of the V-Dem dataset. Here, they have provided a country name, a unique country id developed by V-Dem and the Correlates of War (COW) project country codes, which is a common identifying variable in country-year datasets.
| country_name | year | country_id | COWcode | v2x_corr |
|---|---|---|---|---|
| Afghanistan | 2020 | 36 | 700 | 0.869 |
| Albania | 2020 | 12 | 339 | 0.724 |
| Algeria | 2020 | 103 | 615 | 0.689 |
| Angola | 2020 | 104 | 540 | 0.579 |
| Argentina | 2020 | 37 | 160 | 0.433 |
Now, let’s take a look at the dataset from the World Bank. The World Bank dataset has two identifying variables iso2c and iso3c. These are codes determined by the International Organization for Standardization (ISO). The 2c and 3c suffix indicate that the codes are the two-character and three-character versions of the codes. There is also numeric versions. These ISO codes are widely used in international affairs with the iso3c codes being used on machine-readable passports.
| country | iso2c | iso3c | region | date | gdp_per_capita | population |
|---|---|---|---|---|---|---|
| Afghanistan | AF | AFG | South Asia | 2020 | 516.8668 | 38972230 |
| Albania | AL | ALB | Europe & Central Asia | 2020 | 5343.0377 | 2837849 |
| Algeria | DZ | DZA | Middle East & North Africa | 2020 | 3354.1573 | 43451666 |
| American Samoa | AS | ASM | East Asia & Pacific | 2020 | 15501.5263 | 46189 |
| Andorra | AD | AND | Europe & Central Asia | 2020 | 37207.2220 | 77700 |
What we want to do here is to compare the ID variables. Both datasets have a country name and year column, albeit under different names, but beyond that, they do not have any common ID variables, either in name or in content. The V-Dem dataset has its own country_id variable along with the COW ID variable. The World Bank dataset on the other hand only has iso2c and iso3c variables. This means that we have no common standardized variables between the two datasets which makes it impossible to merge. Some may be tempted to use country names but that rarely works easily due to the varieties of spellings and lack of standardization of country names. For instance, in the V-Dem dataset Ivory Coast is used as a country name whereas the World Bank dataset uses Cote d’Ivoire. Because of these irregularities in the country names, this does not work as a key variable for merging the datasets. What we need is a tool that helps us easily create an identifying variable that is uniform between countries. Luckily, the countrycode package does just that.
countrycode is the main function of the countrycode package. This function takes a vector containing codes or country names and converts it to another coding scheme. When you use this function you have to specify both the coding schemes of the variable you want to convert and what you want to convert it to (the destination). The basic countrycode functionality takes the following arguments:
countrycode([ID column to be converted], [origin coding scheme], [destination coding scheme])To get a list of all of the different codes available you can run ?codelist in the console. There are ton of different coding schemes. Luckily, countrycode has the coding schemes that are specific to both V-Dem and the World Bank’s version of the iso3c coding scheme. The World Bank variant of the iso3c adds a country code for Kosovo (XKX). Let’s add the World Bank iso3c codes to our V-Dem dataset and check the results.
library(countrycode)

### Adding the iso3c codes to the V-Dem Dataset
vdem_2020_iso3c <- vdem_2020 %>%
  mutate(iso3c = countrycode(country_id, "vdem", "wb"))

### Checking missing country codes

filter(vdem_2020_iso3c, is.na(iso3c))
country_name year country_id COWcode v2x_corr iso3c
1 Palestine/West Bank 2020 128 NA 0.231 <NA>
2 Somaliland 2020 139 NA 0.602 <NA>
3 Zanzibar 2020 236 NA 0.676 <NA>As you can see, we have four countries that don’t have an iso3c code. Three of these are expected. The World Bank does have data on Somaliland, which remains unrecognized, or Zanzibar, which is an autonomous region of Tanzania. There is also a conflict between the datasets as V-Dem separates the West Bank and Gaza into two separate countries for all data post-2007, while the World Bank has a single unit called West Bank and Gaza. In the V-Dem dataset the countrycode function has assigned the West Bank and Gaza country code to the Palestine/Gaza country unit. Because there is a mismatch in the territorial units that these datasets are covering, I will exclude this case from the dataset. Lastly, Malta has not been assigned a country code. This may be due to the countrycode package using V-Dem country codes from the 2018 version of the dataset. Luckily, for cases like this countrycode has an argument where you can modify the matches. Here, I am assigning Malta’s V-Dem country ID (178) to its WB iso3c code (MLT).
### Creating custom match criteria
malta_match <- c("178" = "MLT")

### Creating new dataset
### Adding custom match argument and filtering out countries

vdem_2020_iso3c <- vdem_2020 %>%
  mutate(iso3c = countrycode(country_id, "vdem", "wb",
            custom_match = malta_match)) %>%
  filter(!country_name %in% c("Palestine/West Bank", "Palestine/Gaza", "Somaliland", "Zanzibar"))

### Check to see if there are cases missing iso3c
filter(vdem_2020_iso3c, is.na(iso3c))
[1] country_name year country_id COWcode v2x_corr
[6] iso3c
<0 rows> (or 0-length row.names)### Check Malta and Kosovo
filter(vdem_2020_iso3c, country_name %in% c("Malta", "Kosovo")) country_name year country_id COWcode v2x_corr iso3c
1 Kosovo 2020 43 347 0.351 XKX
2 Malta 2020 178 338 0.194 MLTMerging the data and making the plot
The V-Dem data looks clean now. We have successfully added the World Bank’s iso3c country codes to the dataset. Now it is time to merge the data and make our final plot.
#| echo: TRUE
#| warning: false
#| message: false

### Merge the dataset
merged_df <- left_join(wb_df, vdem_2020_iso3c)
Joining with `by = join_by(iso3c)`### Plot the data
ggplot(merged_df, aes(x=v2x_corr, y=gdp_per_capita, size=population, color = region)) +
geom_point(alpha=0.5) +
scale_y_log10(labels=scales::dollar_format())+
scale_x_continuous(breaks=seq(0, 1, .25), limits = c(0,1),
labels = c("0 - \n Low levels of \n corruption", .25, .50, .75, "1 - \n High levels of \n corruption" )) +
scale_size(range = c(.1, 24), name="Population (M)", guide = 'none')+
labs(title = "Political corruption index by GDP per capita (current US$), 2020 ",
x = "V-Dem's Political corruption index",
y = "GDP per capita (current US$)",
caption = "\n Data sources: Varieties of Democracy Dataset v12 <https://www.v-dem.net/> \n
World Bank <data.worldbank.org/>")+
theme_minimal() +
theme(legend.position = "bottom",
legend.title=element_blank())Warning: Removed 46 rows containing missing values (`geom_point()`).
Conclusion
This tutorial gave an overview of how to merge country-level datasets that have different coding schemes. This is a data cleaning process that takes some time and can be intimidating for people who haven’t done it before. Luckily, there are an increasing amount of tools that make this task easier than before. There are also compilation datasets that do this work for you. For instance, both of the datasets here are included in the Quality of Governance dataset. An excellent resource that combines datasets, so you don’t have to. However, I think the ability to work with different coding schemes is an important skill that transfers outside of working with country-level datasets to all sorts of different data analysis tasks.